Laura Munkholm:
Hi everyone. Since you're all over the world including Natalie who's here with us today, Um, I'm Laura, I'm one of the founders here at WALLA, and I know many of your names on this list. Thank you for coming today to chat about the future of studio intelligence. We are really, really excited about the work we've been doing kind of behind the scenes based on your feedback, based on where we've seen this industry growing, going, and hopefully growing. And, uh, we are really, really excited to share what we're launching in the next couple of weeks here. Um, I've brought on Natalie, who is our head of product, and she's joining us from London. So that's why it's dark in her background right now. She's on the other side of the world. Um, but Natalie is gonna be walking us through the details of our new performance dashboards. And before we dive in, I just wanted to give you guys a little bit of background on the why behind it and how we've kind of shifted our not shifted, but enhanced our focus here at WALLA. We, over the last couple of years, have just consistently seen data around studio profitability and particularly in the boutique fitness segment. Studio profitability, while it's going up and definitely getting better since COVID, has been a challenge for many businesses, um, especially sustainable profitability. So we look at that as more than about a 20% profit margin. And we know in most platforms, including Walla, there are a plethora of reports that you can look at, and sometimes it's hard to really get to the bottom of where the problem might lie in the business. So we put our heads together and really decided we wanted to focus on giving you access, clear access to the data that really moves the needle where you don't have to hunt around for it. It's delivered to you in a way that's specific to your business. So Natalie is gonna be walking through all of that today and sharing, um, the how to, some of the details behind what the report mean. And then as many of you saw, this is a two part webinar series. So this is the first. This is kind of the what and the how. And then next week, we'll be jumping on with Joshua Poole, who is our new business and marketing growth coach here at WALLA. And he's gonna be talking into talking about some of the benchmarks and really leaning into setting your goals and then how you can be measuring them moving forward for ultimately driving more profitability in your businesses. So, um, Natalie, I'll turn it over to you. You can introduce yourself and just talk about, uh, you know, how long you've been at Walla, and then we can dive in.
Natalie Efstahiou:
Cool. Thank you. Um, hi, everyone. For those I don't know, my name is Natalie Estacio. I've been at WALLA since the beginning, since 2020. Um, so been building and, um, you know, updating and listening to all of your great feedback and, uh, helping grow all of your businesses. So, um, it's been really fun, and this is my first webinar. So, um, please bear with me on this. But, uh, I, uh, I'm excited to show you what we've we've been working on. So I'm gonna start sharing my screen, and then, um, actually, we're gonna switch, and then Laura's gonna share hers for a bit. There might be just a little switch there, so I'll get started.
Laura Munkholm:
And, guys, just a quick, um, housekeeping. If you have questions during the webinar, you can use the q and a button. So it's on the right side of the screen. Um, that helps us track the questions so we can mark them as answered or not. And sometimes if we get chatty in the actual conversation chat, things get lost. So please ask your questions in the q and a.
Natalie Efstahiou:
Alright. Alright. So, um, as Laura mentioned, our studio performance dashboards that have AI will be coming out very shortly. They're in beta right now. And, um, part of powering our AI that is really important is going to be setting goals. And so goals are obviously very personal and very specific to your business. Josh, in our next webinar, is going to be able to walk through some of, like, the benchmarks, and, um, you guys can really dig in and ask him questions around how to goal set, maybe, you know, just some general rules of thumb around, you know, where this number should be. So, um, he will be able to help you out with all of that. I'm just more so gonna focus on how you set it up and how the product works for now. So we have, um, a few different dashboards. So we will be having more dashboards coming out pretty soon. So right now, all of the goals match those dashboards, and the goals are categorized based on those dashboards. So we have financial goals, lead goals, client goals, class goals. The dashboards that we will be adding will be appointment goals, um, and then also plan goals. So those will be coming up soon. Um, so right now, we're just gonna focus on the ones that we have. So I'm just gonna show you, uh, briefly how to set a goal. So we'll just pick MRR. So if I go into the goal, I hit edit, I can see that I have multiple locations. So if you do have multiple locations and all of them have the same goals for, you know, whichever metric that you are filling out, then you can just choose all locations, and you can just set that goal once. If you do that, um, any goal that you put in is going to be per location, but it will add up into the total on the right hand column. So that doesn't mean that your goal is 220,000 for each studio. It's just adding that up just so that, um, that's clear. But um, most of the time, it seems like for most of these metrics, you will have different goals for different locations. So you'll select that location. And then we're in the metric of MRR here. And so there's a few different ways that you can set goals. So you can set them as the same goal every month for the next twelve months, um, or you can set a fixed range. So for some of you that use, uh, quarterly goals, it's not going to be a quarterly set, but you can divide that up and set that per month. So you could say, okay. I wanna set January 1 through March, so that's my first quarter. And then you can take whatever that goal is and divide that by three, three, and that would be your monthly goal. And so then you can set your goal there. Um, and then, obviously, all of that will add up on the the right side. Or if you have just one month goal so say, you know, January is a big month for most of us, so that would be maybe a higher goal than than February, potentially. So then you can set those individual months as well. And you can always come in here and remove them, uh, and update them, uh, as you as you please. So all of the goals work that way. So, um, I'm not gonna walk through all of them. If you have not set a goal, you'll see that it will have a label here that the goal has not been set yet. But, uh, once you've set that goal, then you'll have all of that here. And then I'm gonna go into the dashboards, but I'll have Laura share her screen for that.
Laura Munkholm:
Alright. And, guys, I know it might be a a new experience to be goal setting for a lot of these things. There are gonna be metrics in there that perhaps you haven't, um, thought about before, so don't be intimidated. I intimidated. I I think what we're gonna talk about a lot next week is start with the most critical KPIs to you. You don't have to have all of them set to start. Um, but as you get going and as you start, um, really getting comfortable seeing how you progress towards your goals, it's gonna be nice to have the all of the critical KPIs under each column, which we'll go through now. Uh, alright.
Natalie Efstahiou:
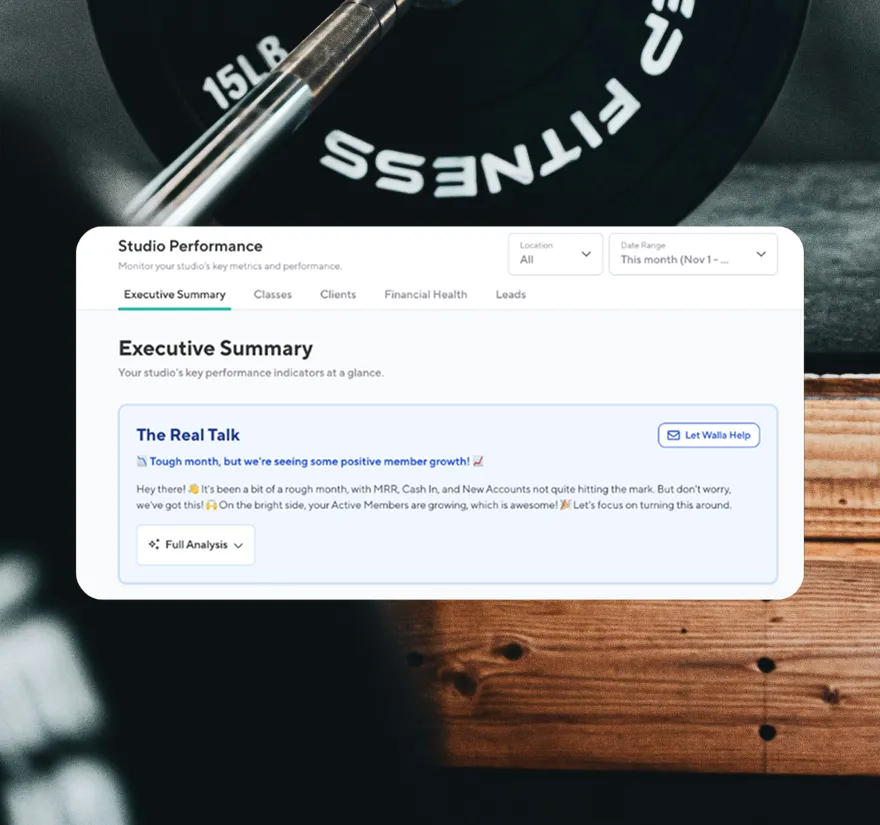
Okay. Perfect. So the first one we have is the executive summary. And so all of the dashboards structure. So you'll have the real talk section at the top, and that section is going to be the AI analysis. And so if you don't have your goals set, the AI analysis will still work. It will be kind of be based on trends that it's seen in your data. But it will be much more helpful and much more actionable if you have your goal set because then it's going to measure against your own goals. So it will tell you if you've been hitting those goals. It will tell you how you can hit those goals. It will highlight some of your strengths and give you an actual action plan so that you can make sure that you are hitting those goals. So, um, it will list out, you know, all of these different items and focus on whichever metric it should be focusing on, but all of the metrics that go into this AI are the metrics that you see below. So all of these cards below is what is powering, um, those suggestions. And so for these cards, this executive summary is sort of supposed to be, these are my critical KPIs. This is what, you know, I wanna look at every day or, you know, every week, whatever that may be to see just, like, overall, this tells me how my business is doing. So the key ones that we've selected here are MRR because that's revenue that you can count on, um, your cash in, your new accounts created, and your total active members. And so as you can also see, we have where you're at right now, um, in in there. And so you'll see that you have the MRR is going to be the last full month. So some of these cards are going to compare against the same time frame last month, and then some of them will compare against a full month to the full month prior. And then some of them will compare the this day to this day at this time last month. So there's a reason for all of that as to why they are a bit different. So for MRR, for example, because that's a monthly metric, we need to wait until the full month has been completed in order to actually give you that accurate metric. So whenever there's something monthly, then it most likely is going to need to have that full month. So if we're in October, you're going to see September's, and then you will see that compared to the previous month of which would be August. And so your goal will also be prorated. So if you, um, if you have set that goal for sorry. I need to make this bigger real quick. If you've set that goal for, you know, October through October 1 through October 30, then you will see that, um, this is the number that you need to make to actually hit that, um, metric. So if your goal is a 100,000 and where's one day left, then it will show you, you know, where you're at, but then what you need, uh, to actually hit that 100,000. Um, and then you have your cash in. And so the cash in is going to be all of your, um, cash that you've actually received. Uh, and then that's also gonna be prorated, and then you'll have your new accounts. And so your new accounts are anyone that's created an account, uh, via, you know, the widget, via the app, via the front desk. So you'll be able to see that time frame, um, that you're looking at is, you know, to date, and then you'll see that compared to that same exact time frame to date, uh, in the previous period. And then your total active members is based on one day. So that is based on today's date, and that is going to be compared to today's date or to that date of the month last month. So those are some of the key metrics there, and then we can, uh, you can also see that each calculator there, uh, uh, will give you the definition. So if you're curious to see more details, if you forgot exactly how it's being measured, then you can see based on the calculator that, um, that's the exact description of what's being measured there.
Laura Munkholm:
And there are some reports that have this little kind of bar chart at the bottom that will take you into the detailed report. So you can always hop in and see what's what's contributing to that number right there. And that way, if you wanna see who those people are or a little bit more granular information, you can just pop in.
Natalie Efstahiou:
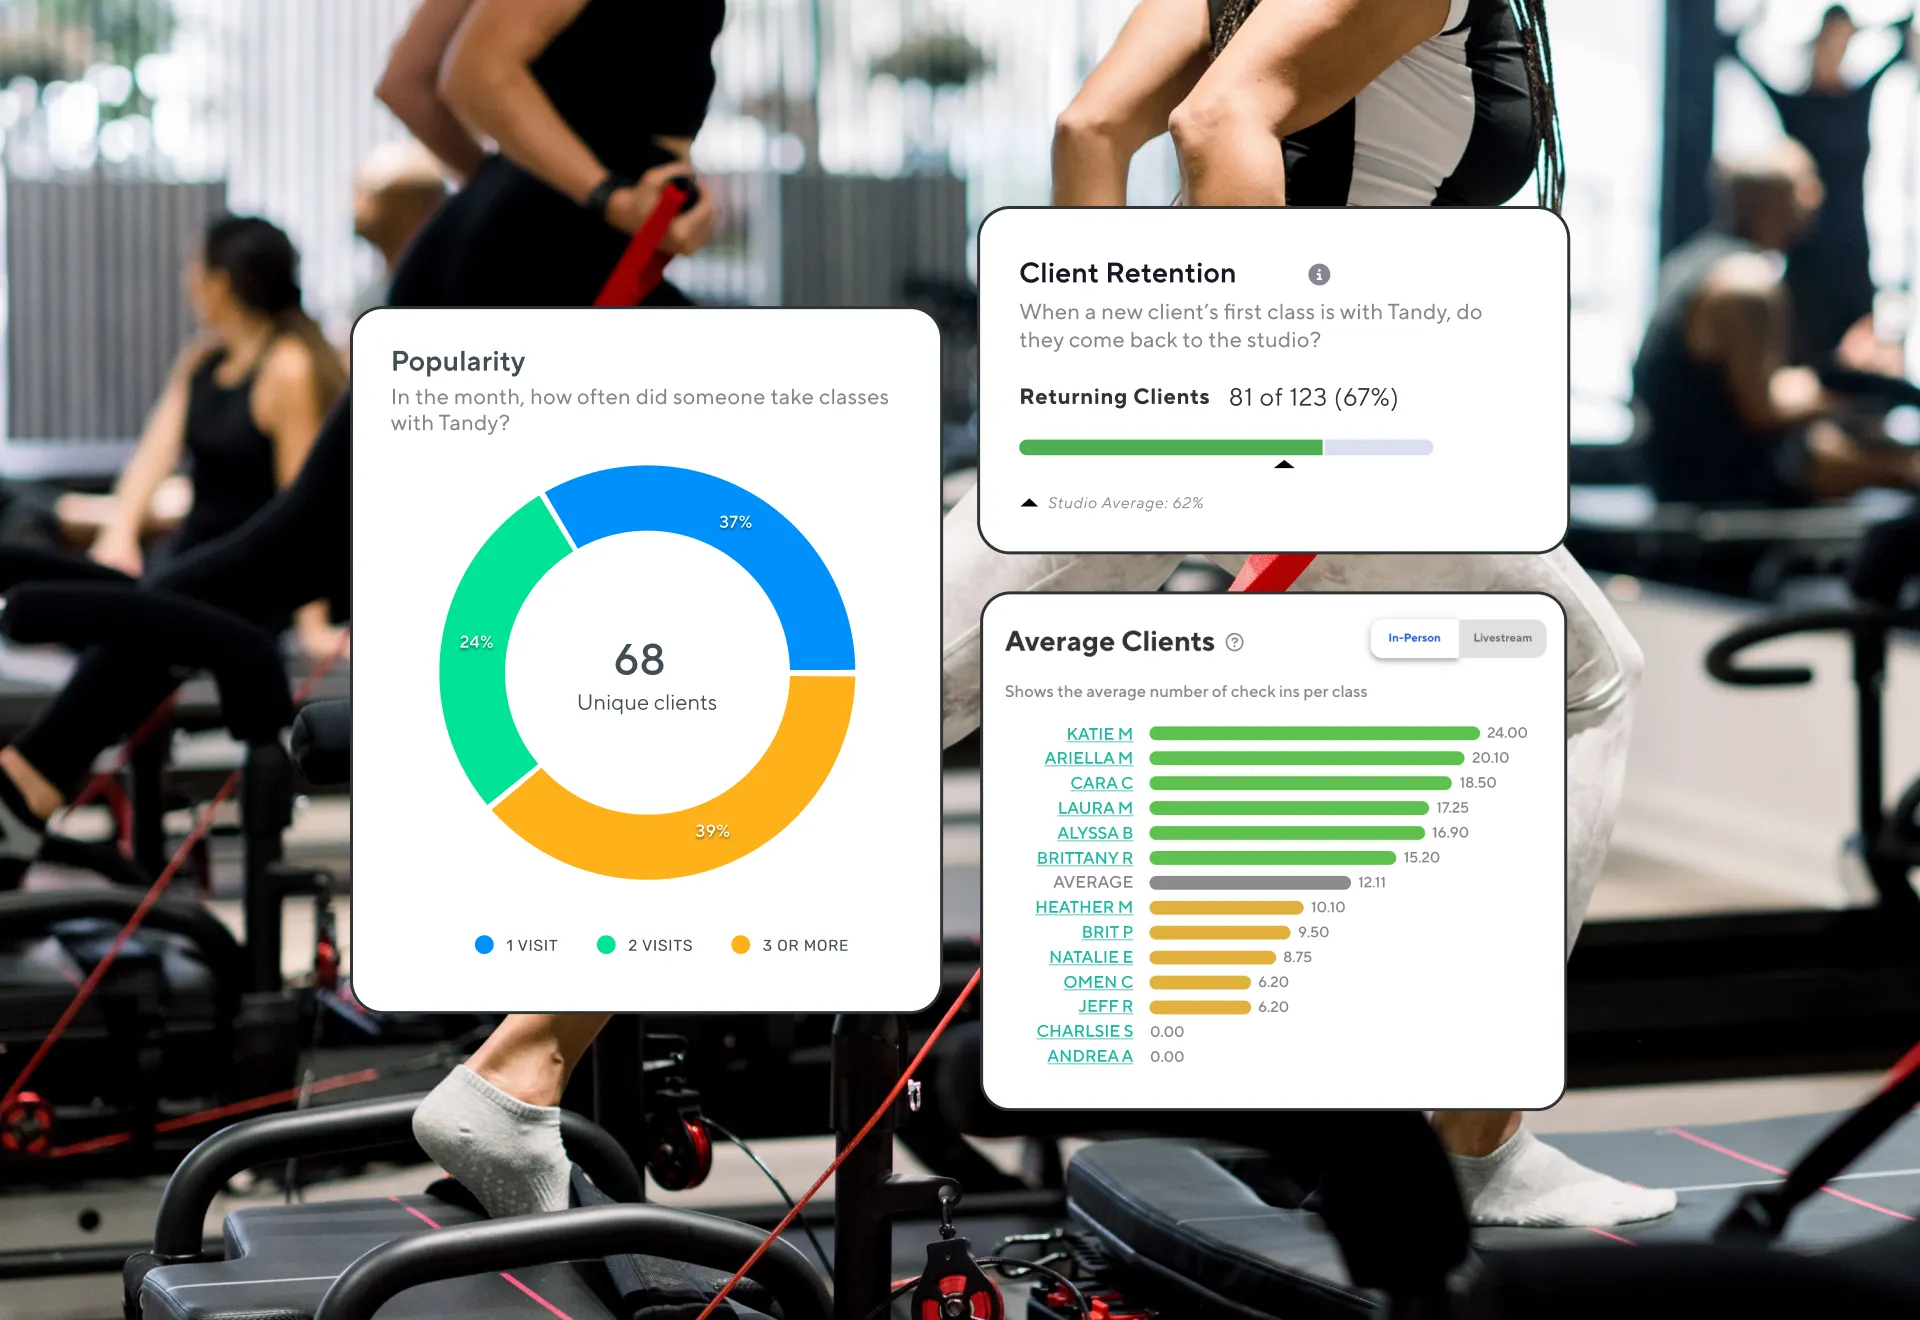
Alright. Alright. So then we have the classes. So the class performance is going to do the same thing as the executive summary. So that is going to show you, um, your AI section. So it's going to give you those same results based on the cards below. Um, so it may just take a few seconds to load because it's ingesting quite a bit of information. Um, and then it will, again, show you your strengths and then give you some advice and some actions to take. And so the the key metrics that we are measuring for classes is your average fill rate per class. So your average fill rate fill rate per class, um, is going to be based on your fill rate out of the capacity across the average of how many classes are offered. So, um, you know, your goal for this might be will likely be a pretty high number because that's how many people are attending your classes. Uh, your no show rate's pretty straightforward. Anyone who is not showing up to your classes on average, what that rate is. And then your, uh, average class rating. So, uh, if for those of you that don't have ratings set up, this will have a, um, image for you to go into the business settings to go set up your ratings if you would like to enable them. Um, if you have them enabled, this metric is going to show based on the last six months because we want to make sure that it's accurate enough. And when we prompt you for reviews, we typically prompt you one time for that instance. And so it might be quite a while, uh, for us to collect some of those reviews if it's been, um, you know, just a few days into the month. So we're showing based on a six month average so that you can get a really good idea of what that number is. Um, and then below that, we have, uh, two different graphs. So one is the peak hours. And so this is a really nice just like visualization of what classes are performing the most at what time. So this is a total of all of your classes. So in order to dig into that, um, you can also visit the class utilization report to see which class or the graph to the right, um, is also showing you some averages per class type. But the peak hours is based on whatever your classes start. So it's the start of the hour to the end of the hour to show you sort of, like, how those classes are performing in terms of fill rate and utilization. And the weekends are obviously quite different and should be measured a bit differently than the week weekdays. So we've separated out the weekends. Um, and so you can see, like, this one is really nice. You know, 11AM is definitely killing it. Maybe that means that you should have an 11:30 class or a a 12PM class or something like that, um, just to give you some ideas of how you can visualize this data. And then the the one on the right, as I mentioned, is per class. So you can see your average fill rate per class, uh, the capacity that it has, and then the rating. And all of this data is based on in person attendance. Uh, the reason for that is because live stream can get skewed since we have such a high capacity for that. So it could be you know, 99 out of 99. And if one person shows up, we don't wanna take down your average for that, um, class in total because of the live stream. So we can go to Or
Laura Munkholm:
do you wanna call out just quickly. We have this button here at the top of each of the AI analysis cards, um, that says let WALLA help. And the reason for that is we we understand that there's going to be, uh, you know, essentially quite a few of you who are like, okay. Great. This is awesome information. I really don't know how I should make any changes. They're giving you some suggestions that the actual, you know, tactical steps to make the changes might be something you've never done before. So that's gonna connect you with our studio marketing and growth consultant, and he'll be able to help you look at some action steps to move the needle in the right direction and, in some cases, actually help you, um, check some boxes. So please don't be shy. That's absolutely something that's a resource for all of you. We understand that not everyone has a a studio coach in their back pocket, and we want to make sure that we're giving you some resources to be successful in the software.
Natalie Efstahiou:
Yeah. Thank you for that. I'm actually gonna back up to go over sort of, like, this part of the layout too. So Okay. Up at the top, if you scroll up just a bit, you'll see that there are filters. So these are filters that will apply to all of your dashboards. So the location filter, it will default to whatever permissions that you have, uh, at two locations. So if you only have permission to coast, then that will default to coast, and that's the information that you will see. So if you're looking at all, it's adding up all of those goals, all of that total. If you're looking at each location, it will just be whatever is set for that location. So, um, you can always play around with that. And then the date range right now is per month. Um, we will be adding some additional date ranges to this. But for now, it's per month. That's how the goals are measured, so it's just easiest to see that way. Um, but we will be adding some, uh, additional ranges to that. And then in some of the reports, not in the executive summary, but in most of the reports after this, uh, we do have an all reports link. So anything that's related to classes will show up here. So you can quickly if you wanna dive into, like, the class utilization, more details about how it is per week, you can easily click that from the class dashboard.
Laura Munkholm:
Awesome. Um, I'm gonna pause really quickly just to go into some questions because I know we've gotten a few. Okay. So with the studio performance cards, can you filter by studio if you're multi yes. She just answered that, so I think we're good there. And and it'll filter the total based on the views. So that location kind of that setting will determine what the cards say. And then when does this begin? When does this go live?
Natalie Efstahiou:
We'll talk about that, uh, maybe at the end. Yeah. Okay.
Laura Munkholm:
Yeah.
Natalie Efstahiou:
Cool. So alright. The client's section. So most of these metrics on the client section are mostly about members. Um, the one that isn't just for members is the, uh, churn risk while it predicts section. So, um, again, same layout, same options. Um, and then the metrics for this one would be your total active members. So this is everyone that has member has a plan that has a membership status. Um, your member retention rate. So this is, uh, this is one of those that's going to be measured on the last month. So the last month will will be what your benchmark is for this because we need to know of those people that had a plan in the previous month, did they still have a plan in the following month? So the retention rate is measured on a on a monthly past month basis compared to the previous month before that. Um, some of these goals, uh, we removed. Like, the churn risk goal, for example, we removed because, obviously, for most people, that should be zero. Membership retention rate, obviously, most people want that to be a 100. So, um, but maybe that's not realistic. So that's obviously going to be quite a high number, but you can set that however you please. Um, but we left it there just, you know, to have as a good visualization. Um, average visits per member per month, this is counting just your members and then the average visits that they have had per month. And the way you can think about this, I know it it might be sort of difficult to think about that number because there are different types of plans that maybe offer different visits. But this one is really supposed to be, you know, of any regardless of any plan that they had, what is your goal to have how many of your clients taking class per month? Regardless of the plan, um, just to kind of think about it as, like, a high level growth, uh, goal number. And then we have the churners, which is pulling in, uh, the data from your oh, yes. Uh, sorry. Your average revenue per, uh, per member per month. So this would be the number of, um, spend based on per member per month. So however much that member has spent broken out average per month. And then, yeah, the wallet predict is something that you guys have seen on your dashboard and maybe played around with, and we'll talk through that, uh, at the end if we have enough time. And then we have membership trends. So another just really nice visual so that you can see. So this is going to just measure your new members and your churned members. So we're not we're not looking at existing members here. We're just trying to give you a quick visualization to say, okay. My July had a lot of new members. That seems to be a really good month for people to join. And, well, in this case, it's a bit interesting. But in real data, that's not demo data. Hopefully, they're not, you know, exactly the same. But there may be some months where your churn is super high and so much where your churn is super low. And so that's something to kind of think about maybe in terms of sales. Like, if your if your new members seem to come at x months, then maybe you offer, like, promotions during that time or sales during that time or whatever that may be. So you can you can sort of analyze that however you please, but it's a nice way to just visualize it really quickly. And sort of just to take a quick step back, when we're looking at all these dashboards, the main goal is to give you an idea quickly that you can see how is my studio performing, am I hitting my goals, is this looking good. It's, um, less about, you know, digging into each one of those details. It's more about we're trying to give you a high level and a quick overview so that you can make decisions so that you don't have to spend hours and hours, like, looking into everything. Overall, this should be, like, a really good pulse check on how your business is doing. Yeah. Um, so
Laura Munkholm:
For those, yeah, for those of you that are, like, going into your software every month and running 25 different reports and then filling out a KPI spreadsheet, the hope is that this replaces that process. You're not doing any manual work, and then obviously if you've got something, you know, focus area, for example, is active members with visits per member. So this is definitely something we wanna dive into is things like incentives for regular visits or, um, more diverse or flexible class schedules because your members are not coming enough. So that's when you can dive into the all reports and say, okay, let's figure out what's happening here. Like, maybe we really need to figure out our our specific class times or our, um, you know, visits by clients so we can kind of look at the frequency over different periods of time and see if there's a difference there. But the goal is to avoid having to run every report every month and really focus on the ones that need attention.
Natalie Efstahiou:
Yep. Alright. And then we have the financial health. So this one is, you know, pretty straightforward in terms of what data we're collecting here. Um, but we did add something very exciting to this dashboard. So we have you know, your sales report has cash in, your net cash in, and so that's obviously very key critical information. But, um, something that we would like to give you is your profit margin, your remaining cash, your actual take home pay. And so in order to do that, we do need to know what your expenses are. So now we have a expense tool in here. So if you click into manage expenses, then you can see we have different categories. So whatever you know, you can you can choose other, but we've tried to cover majority of the categories that you would be selecting here. Um, so you'd select that category, and then you can choose your location. These have to be per location because most expenses will be different per location. And then you can pick your amount, and then you can add that for, you know, all months. And then you can go ahead and adjust your month. So maybe in January, you got a discount on your rent or marketing, whichever one we're in right now, and then you can change just that specific one. Um, and then you can continue to change that. So some of these, you can you can set an average if, you know, you're not entirely sure and it may fluctuate a bit. If ones fluctuate a lot, you can come in here at the end of the month and go ahead and update those metrics so that they are accurate. Um, and then once you have all of your expenses accurately documented, then you can come back into the report and you can see your actual profit margin, and you can see what you're taking home. And I know that the take home metric is really important to to most people and kind of hard to get to. So this helps, um, a lot by by doing so. Yeah.
Laura Munkholm:
Yeah. And, again, what we were talking about at the beginning, the goal of really helping with profitability. I think, uh, there are many business owners I talk to that, you know, dump all of their data over to an accountant or a bookkeeper. They put it into QuickBooks, but there's not a ton of visibility into what you're actually taking home and what your profit margins are and if that's sustainable. But, also, this is gonna help you predict. I mean, if you know that you've you've grown your MRR, you've set your goals to grow your MRR, and you're making your way towards that goal, you're gonna be able to predict your cash flow, your what you're able to spend, what you're able to invest in. And, you know, the goal here is building more sustainable businesses. And like I said, we've got the let while I help button so you guys can absolutely ask questions as you go.
Natalie Efstahiou:
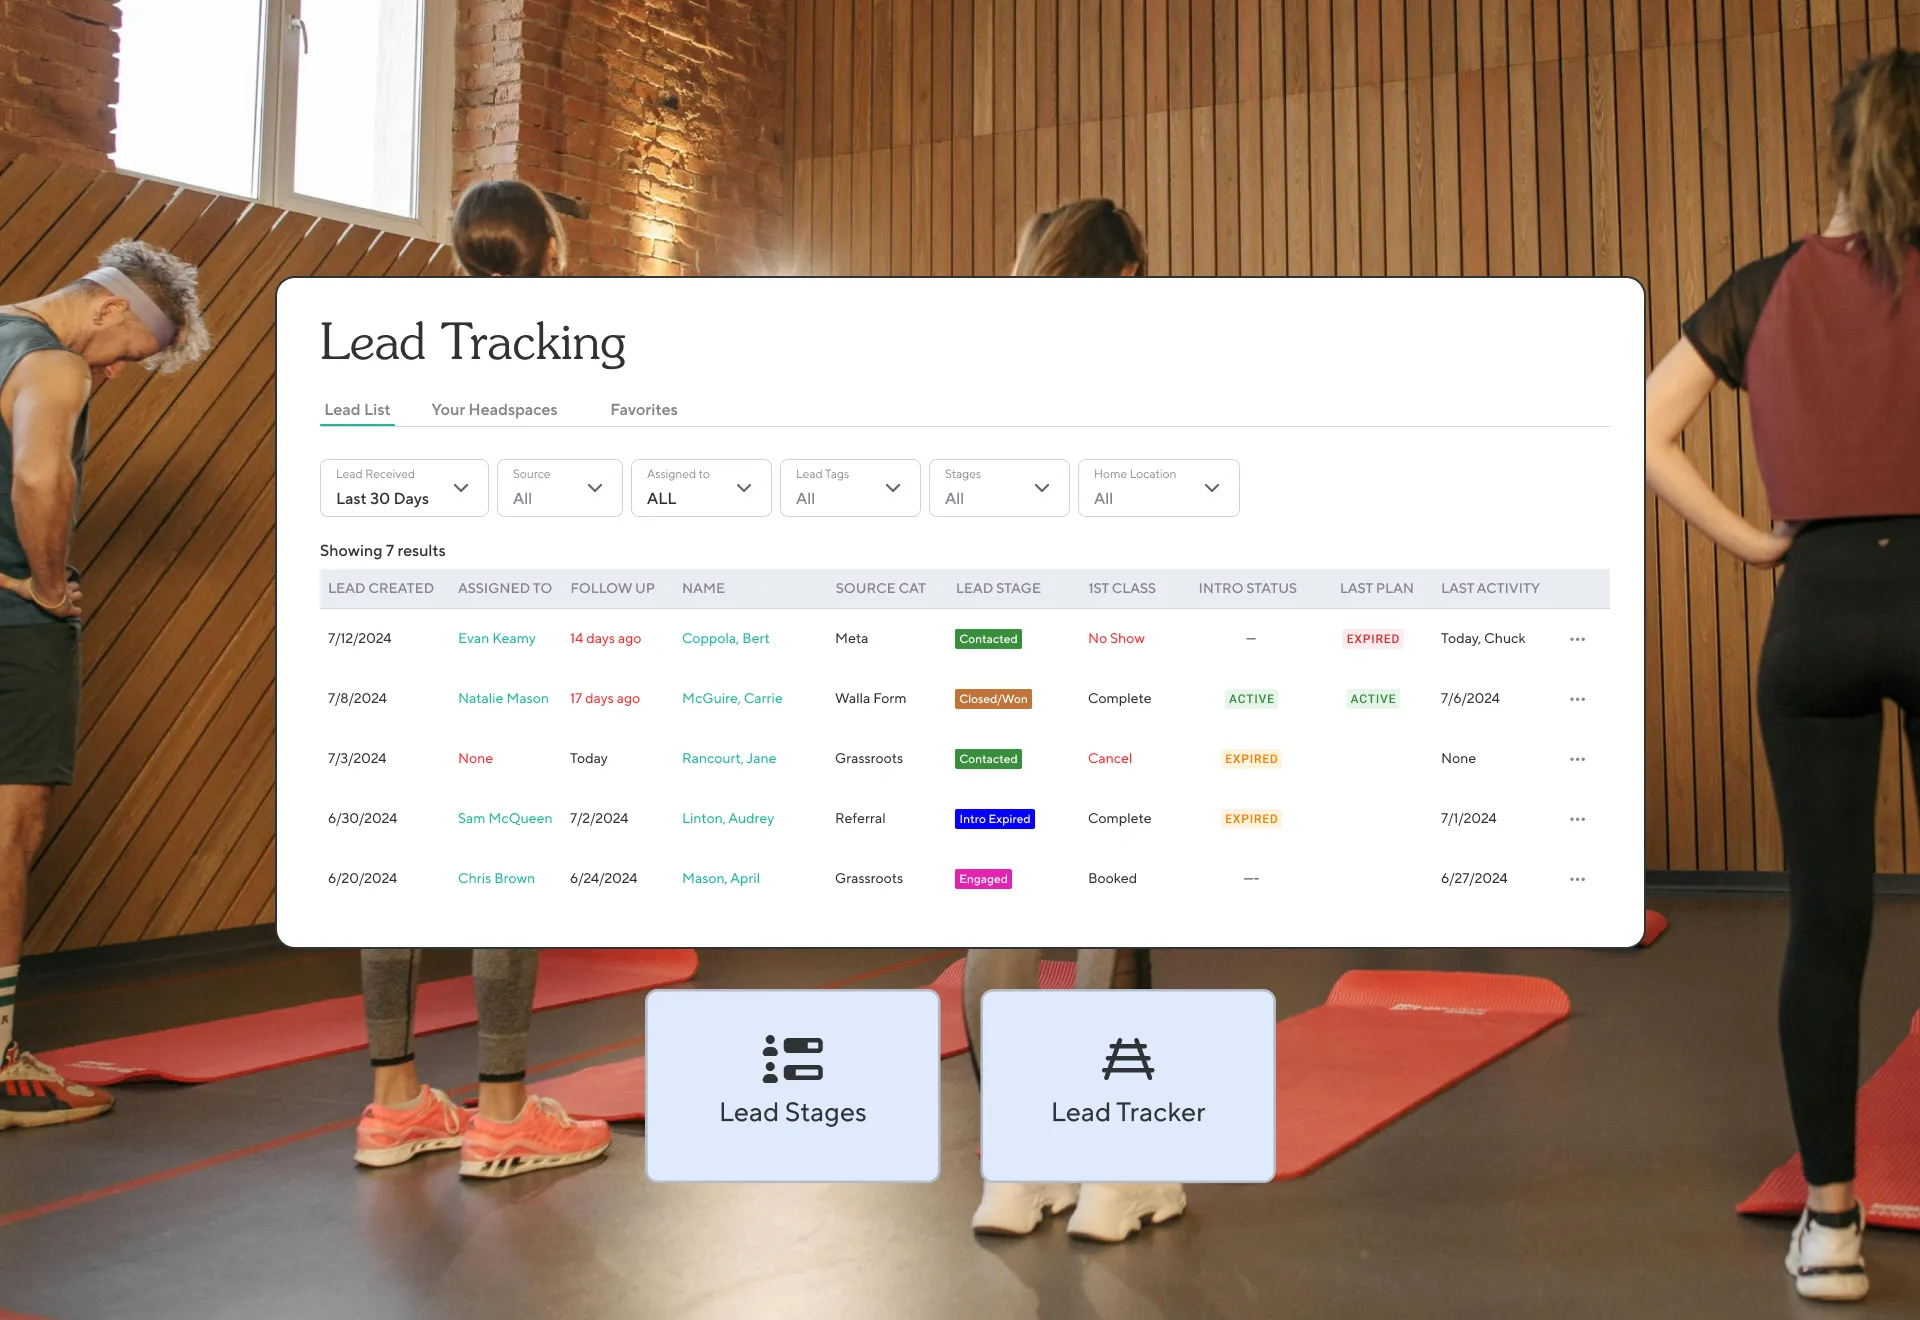
Yeah. Cool. And then we have the lead dashboard. And so we are adding a couple of metrics to this dashboard, but I'll go over what we have right now. So we have leads created. And what's super important about the lead dashboard is that it's using you know, our lead system. And in our lead system, everything needs to be tagged. So the leads created needs to have a lead stage tag. That's how we're pulling in that number. And then the leads to intro offer is any of those leads created with that tag that have purchased an intro offer. And then we have a new metric that is leads to their first visit. So, um, you can see anyone that's actually maybe they bought an intro offer, but they haven't come yet. So you'll be able to see that direct kind of, like, funnel conversion to who actually has made their first visit. And, um, an important note here for the leads is that any lead that has been received in the last five days will be excluded from this calculation. And, uh, the reason for that is because we want to make sure they have a fair opportunity to convert. So if somebody, you know, bought an intro offer on October 31, it's highly likely they haven't made their first visit in that month. So we're going to wait and count them into the next month so that we can actually know that they are, um, converting for you. So that, you know, that five days is sort of an arbitrary we thought that would be enough time if somebody's buying an intro for their likely or they're coming in. They probably have interest. They're gonna buy something within that five days, and then we're giving them that opportunity to to buy it and then to take the class. So, um, that's just a note there. And then the conversion funnel here, so we have oh, sorry. One of the metrics that we will be adding is the intro offer to plan conversion. So, um, that will be coming soon. And the average response time scroll back up.
Laura Munkholm:
Oh, sorry.
Natalie Efstahiou:
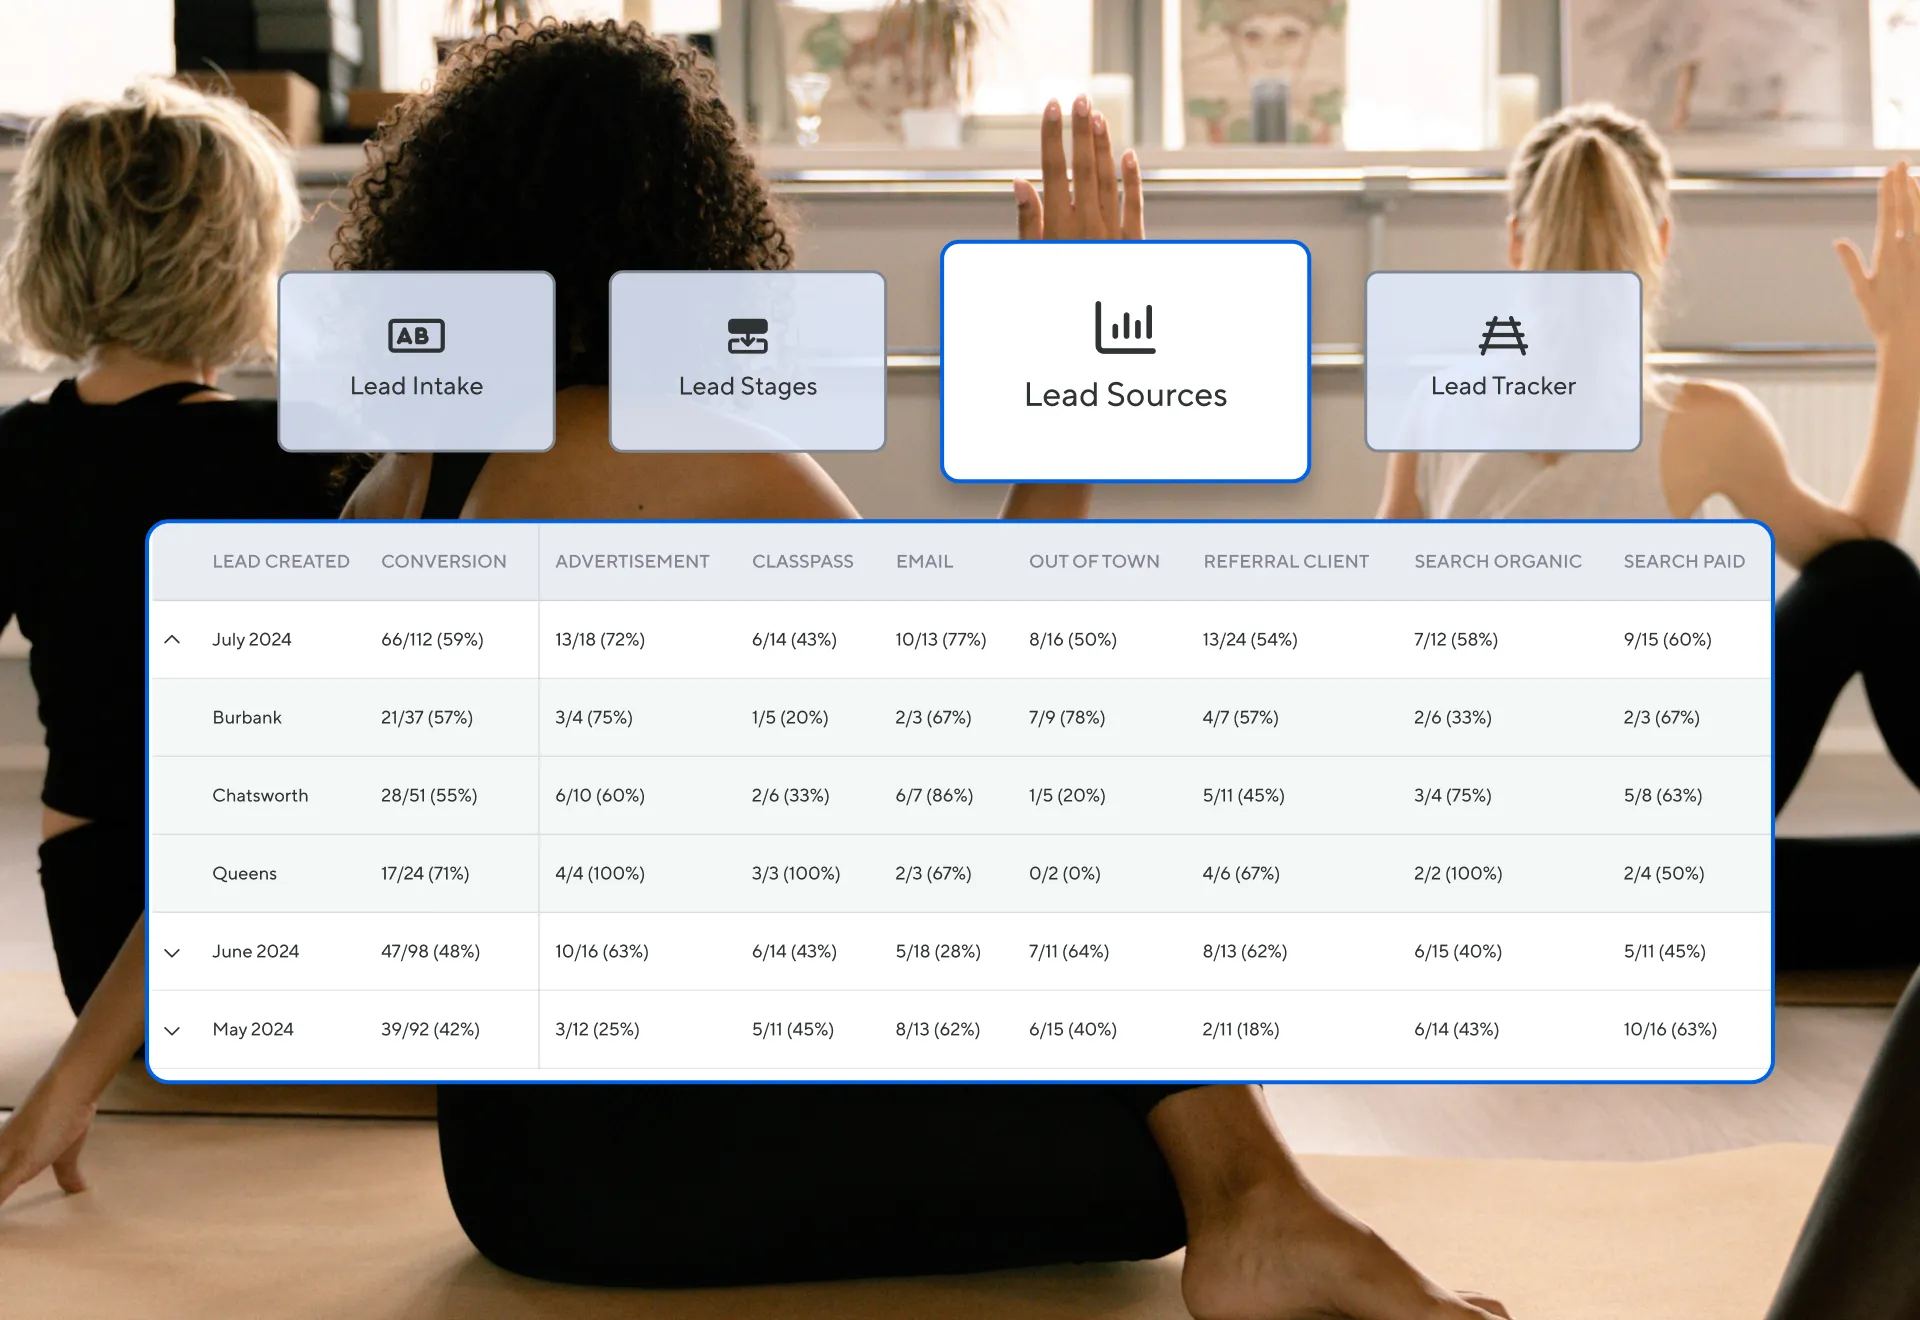
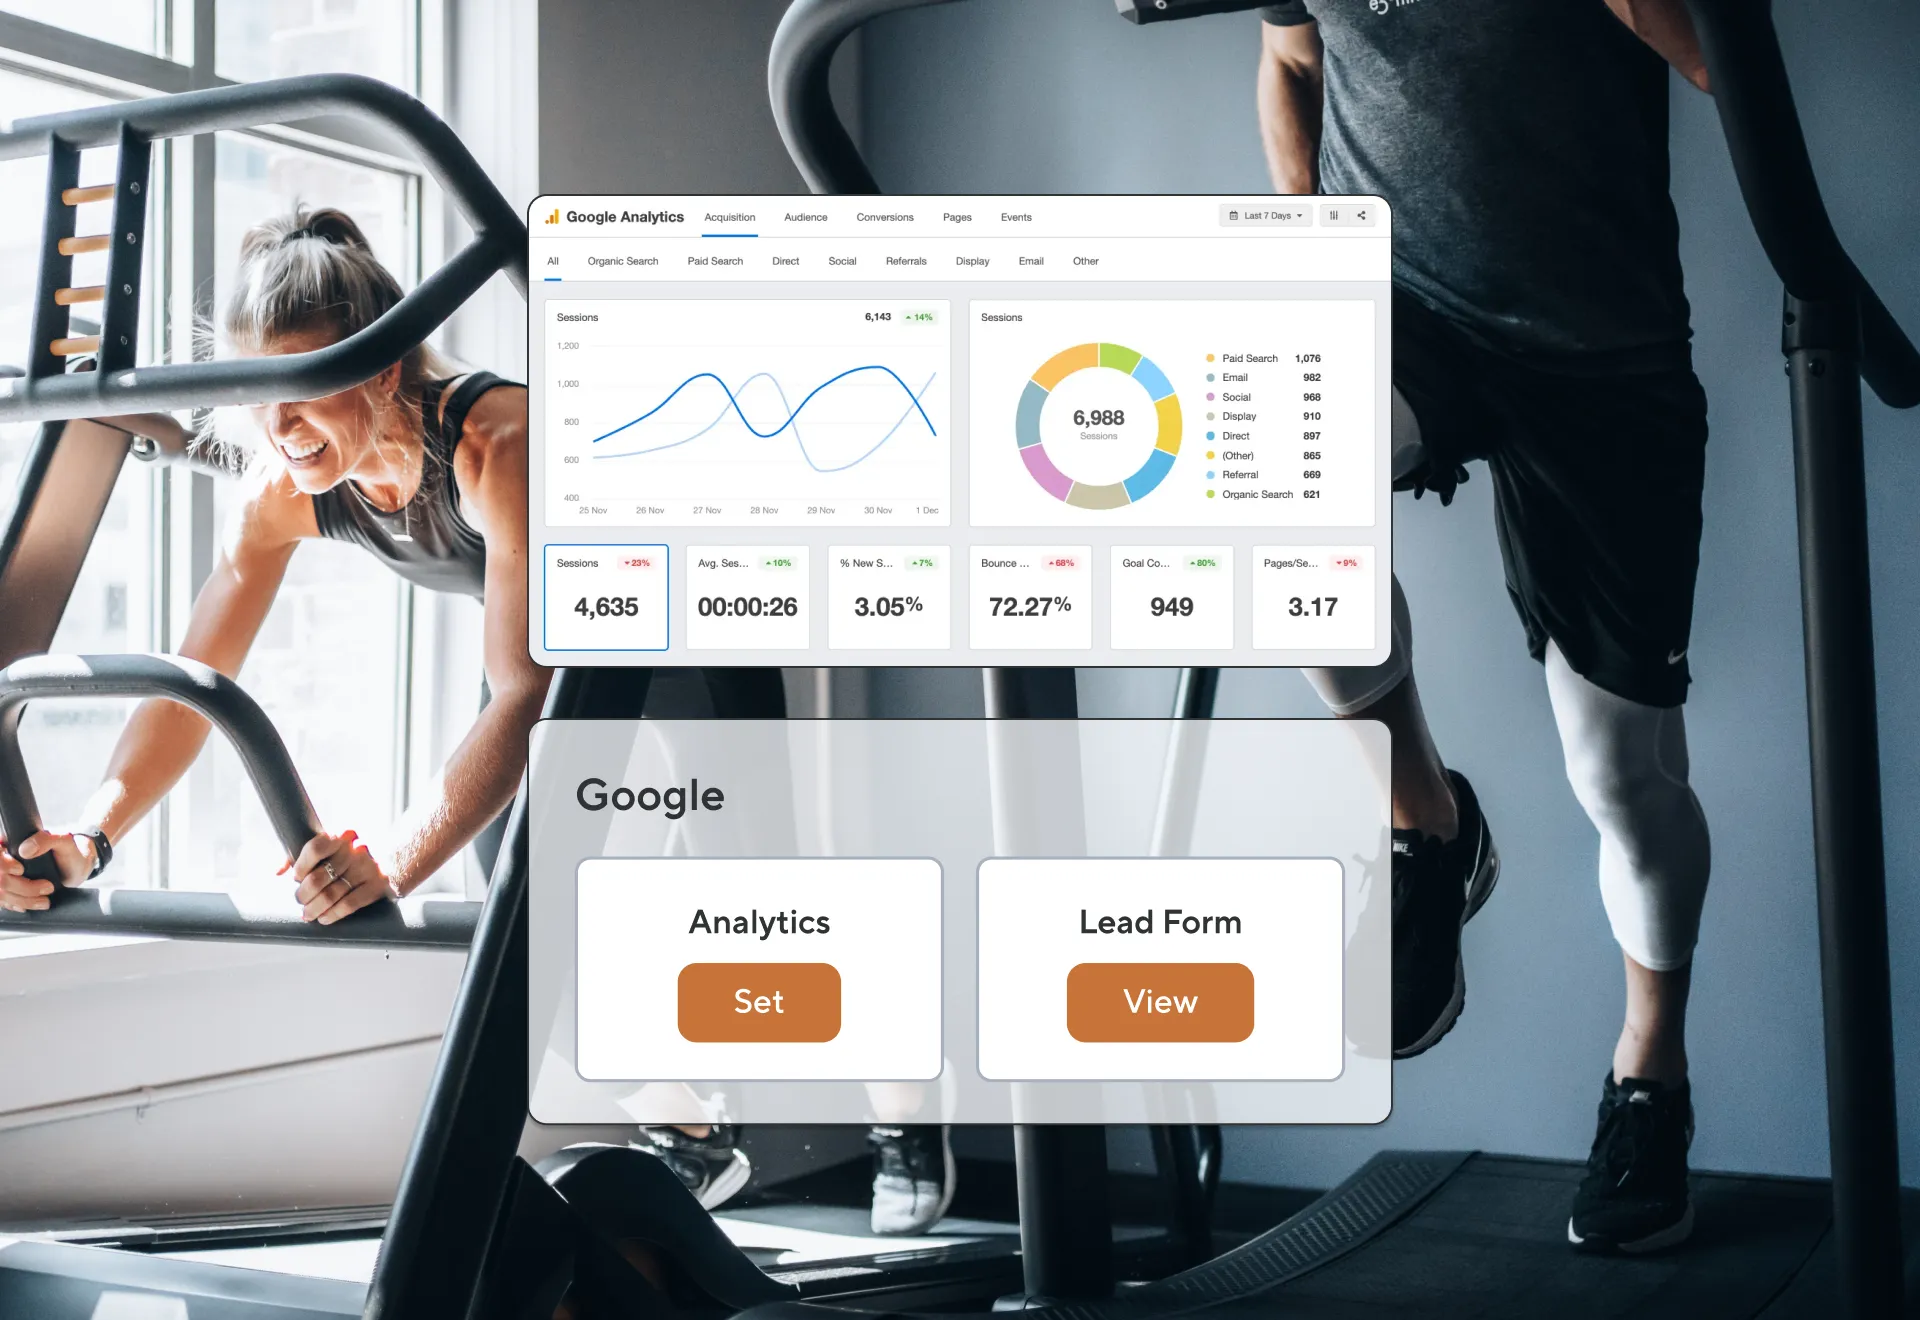
Uh, so the average response time is based on manual connections. So this is not going to count, uh, an automation that runs right after somebody submits a lead form. It is going to only count from if you called them and then you wrote a call note, if you messaged them and you wrote, you know, a message to them directly. So that's measuring the time so that you can measure if your sales staff is, you know, seeing the lead come in and then making a personal connection with them right away or if it's days or, you know, if it's within a a few hours, which hopefully it's in in the hour or minute range, you'll be able to quickly track that. Um, so that's what that number means. So then we have the funnel. So you'll see the leads created and then to when they were contacted, to when they made their first visit, to then when they made a plan, uh, when they made a purchase for a plan. So that's a nice quick visual again for you to see if, you know, you're converting a lot of your leads, not very many of your leads, and where the drop off may be. Um, and then we have lead sources. This is, uh, something that you guys have already had, but we're just kind of showing it in a a better visualization. And it will be, uh, only the ones that have actually come through via that source. And, again, the source that comes in automatically would be Meta, Google, Walla lead forms. And if you don't add the source for anything else, then it won't it won't show up in here. So it's super important that you're adding the source so that you can track where, you know, your marketing spend should be and, um, what's giving you the biggest bang for your buck. So please, uh, use that lead source. Okay. So that's overall the dashboards. Uh, if we want to dive into while it predicts really quick, We can do that. Or do we have any other questions we want to go over?
Laura Munkholm:
Like, we're good on questions right now unless anybody wants to dive in. Anybody have questions about the specific data points that we're pulling in?
Natalie Efstahiou:
Alright. Awesome. Okay.
Laura Munkholm:
Um, okay. So let's go into Moala Predict.
Natalie Efstahiou:
Alright. So we'll click on Ryan just to give an example. I think he's at the bottom.
Laura Munkholm:
Here. Let me just look.
Natalie Efstahiou:
K. Cool. So, uh, as you can see, we have this high AI turn button. So right now, everything is going to say, hi. Um, eventually, we're going to make it even smarter so that it could be a medium risk or a low risk. But right now, everything will say high. Um, the the purpose really of this is to flag things to you. So maybe you know that they actually are ill or they've had something happen and and you're not worried about them turning, that's fine. These are really just supposed to be some indicators that we think could potentially be a flag that they will be turning. So some of those include, you know, your activity history. So if there's been any kind of decline in activity over the last ninety days and we're measuring mostly everything over the last ninety days because that should be sort of the most recent big chunk of time in which this is now going to be an issue, you know, that you need to contact them or, you know, reach out. So then we're measuring things like, is the cost the of their plan based on the number of visits they're taking, is it higher than the drop in price? Then, you know, maybe that's concerning because they're not actually getting the value, and they might be churning. Um, we also have some things if they have a limited plan. Are they utilizing less than 60% of their plan? So plan behavior, visit history, um, if they are consistently getting on the wait list and they're not actually making it into class, then, you know, that might start to to be an issue. And so if you do if you know that, you know, maybe somebody is on pause, for example, um, you can snooze them for thirty days. But if you snooze them for thirty days and then they come on pause again, then, like, maybe that maybe that is a red flag for you to sort of think about why do they keep pausing. Is there is there something they're, you know, considering elsewhere? So, um, you can just continue to to snooze them for those thirty days. Or if, you know, maybe it's an employee plan or something and you know that that's not a risk, you can just snooze that forever. So, uh, any any indicator that comes up after that thirty days will bring them back to your churn risk. And then you can see things like key data. So the visit behavior, um, in a nice visualization of, like, how, you know, they're coming in and when they're dropping off. Um, you'll also be able to see if they've been waitlisted in the last thirty days. You'll see when their next visit is and when their last visit was. Uh, if they have any reviews, we provide a sentiment saying, you know, this person seems to be really pleased or maybe this person left a not so good review. And you can contact them and see, you know, what happened in that class. And then we have the lead score. And so the lead score is really, uh, based on some census data that we are using to say, okay. How far away are they from the studio? So we do need to have a ZIP code here in order to give you a lead score. So at least a ZIP code, um, but preferably the address. But, uh, this will then be able to tell you, you know, okay, their their income score of this area, the distance, um, how many fitness businesses are around in this area. And it will score based on that so that you can say, okay. Well, it looks like, you know, maybe they're really far away, and so they probably are gonna churn, or maybe our pricing doesn't really match what the income is in this area. So it's just kind of giving you a high level of that information. And then the action plan gives you a whole bunch more information about their finances and how much they've been spending at your studio and then also their engagement. So have they been opening my emails? Have they been, you know, communicating? And their personality type, you know, if you have that filled out, then you'll be able to communicate with them based on, you know, how they like to be communicated. And then we have these really nice recommended actions. So these are prewritten for you. You can use them or you can change them, but it's, you know, supposed to be kind of like a snippet so that you could send something really quickly. You can tailor it to their personality type, and then you can also remove whatever the messages and use the AI writing assistant to write, you know, something else that you want personalized there.
Laura Munkholm:
Yeah. I love this is one of the places where you can really leverage the, um, um, personality typology in Walla. So if you have a personality type here and I click this, it would just edit the message to be for a giver or for a thinker instead of just a generic message. And, obviously, I'm their favorite teacher.
Natalie Efstahiou:
Obviously.
Laura Munkholm:
Okay.
Natalie Efstahiou:
So give Laura more classes. Yeah. Exactly. Alright. Cool. That's it.
Laura Munkholm:
I'll stop sharing, and we can chat here. Wait. Where'd we go? Yes. There
Natalie Efstahiou:
are tons of going live. So we're this is in beta right now, and, um, it should be very soon, probably within the next two weeks. Um, we it will still likely be in a beta state because we wanna be collecting feedback from you guys because it is such a big, uh, release. We wanna make sure that, you know, everything that we're implementing here is exactly what is working for you. So, you know, we wanna know, are these the right KPIs? Are the AI suggestions making sense? Is it helping your business? Because truly our goal with this is to make you more profitable, like, is to see your growth. And hopefully, we can collect data on that to really see how these changes are impacting your business.
Laura Munkholm:
Um, I just actually published a poll, so it should be in the chat right now. When you click on that, you can click vote now. But we're we're really hoping to hear from you guys what are some of the critical KPIs that you're looking at. And if we see, you know, something that's dramatically different than what we're putting in the executive summary, that's a conversation we have about, you know, what belongs in in those top tiles. But, also, we wanna make sure that it's easy for you guys to get to to those data points. Okay. Quick question from Danielle. Hi, Danielle. Which parts of the new features are you two most excited about? Oh, good question, Danielle. Natalie, you wanna go first?
Natalie Efstahiou:
Sure. Um, I mean, I think that the leads, uh, uh, section is actually really impactful. So I think being able to, like, see those funnels and then the class section being able to see what your peak times are and what, uh, your biggest months are, I think, is really interesting.
Laura Munkholm:
Yeah. Two parts for me. First of all, the, um, oh, sorry, Brent. The poll only lets you pick one. Well, just pick one right now. I did we we made it incorrectly.
Natalie Efstahiou:
Oh, yeah.
Laura Munkholm:
The two parts I'm most excited about are being able to put your expenses in and see your profitability and really start to be able to predict your cash flow a little bit more effectively. Um, I think that's kind of a a blind spot for a lot of businesses that we talk to, and especially if you're a business that outsources your bookkeeping or your accounting. Um, oftentimes, it's it is a little bit of a guessing game every month how much you're going to be able to invest back in the business, grow with, or take home and live your life. Um, the other part for me too is is just the lead, being able to see the lead funnel, like, how many are coming in, how many are converting to visits, plans, and really, again, start being able to make goals for yourself, goals for yourself based on that data. And, you know, for those of you who aren't using our lead tracker yet or haven't really dug into setting tags and stages, it's a great opportunity to. And, um, oh, I said I was gonna add this in. But, um, on our website, we have a fantastic webinar that we did with Eric from selling wellness. And it's all about essentially building out the different stages and his best practices. He works with some of the, uh, bigger franchises out in the world where you can absolutely learn how they're measuring leads, how they're working a lead funnel, and how they're actually communicating both automations and, um, with manual communication. So I I think it'll be a really helpful way for you guys to set that up and then, again, set goals for the future. Um, I'll add that in in just a second. Uh, let's see. Natalie, what's your spirit animal?
Natalie Efstahiou:
Yeah. I saw that.
Laura Munkholm:
I love you.
Natalie Efstahiou:
Uh, a red panda. Stop.
Laura Munkholm:
That's such a good answer. Wow.
Natalie Efstahiou:
And, uh, my favorite KPI, Lead to inter offer.
Laura Munkholm:
Okay. Yeah. That's a good one.
Natalie Efstahiou:
I think there was a question I saw for a ClassPass revenue. So, no, this does not include ClassPass revenue because we aren't taking any of that money into Walla. Um, something that has been discussed, though, is adding something similar to the expenses, uh, but the opposite way around. So adding different revenue streams so that you could add that in so that you could see more of a total, um, bigger picture if you have revenue coming in from retail somewhere else or something like ClassPass. So that is something that we're exploring too.
Laura Munkholm:
Awesome. Okay. Cool. Um, Kristen was asking about reviews and making reviews public facing. Um, definitely continue to let our support team know if that's something that you're interested in having soon. It is something we're planning. I just don't think we have a timeline for it yet.
Natalie Efstahiou:
Yeah.
Laura Munkholm:
Uh, okay. I think that is all we have in terms of questions. Um, if you guys have, again, feedback as you're getting into these, um, these dashboards and they're released in your platform, Natalie, is there any kind of indicator that you want to have them detail if they're sending feedback into support or just making sure that you send feedback generally?
Natalie Efstahiou:
Yeah. I think just using that, um, button in the AI. So it will at least inform support plus Joshua, so then, um, that can be routed to the right place in case there's, like, some kind of bug that you're seeing versus help with your actual, um, you know, report. So that helps us at least see where you are in the product and further while it predict especially. Um, if you use that button, we actually know whose profile you're on, and so that's super helpful.
Laura Munkholm:
Yeah. Kind of prefiltered, and it'll say whose prediction looks off. You can put the client name in there, and it'll work, um, pretty cleanly. And then if there's anything on the dashboards that you're just confused on or need a little extra guidance, you can reach out about that as well just to the support level and, you know, performance dashboards is really what we call them internally. Alright. Awesome. Well, thank you all so much. Uh, can we post the link for the webinar with Eric? Yeah. I was just looking for it right now, and for some reason, what it's named on our website, I don't think it's it, but I will on demand replay available. Oh, you know what? I'm sorry. It's actually not on our website. It's in our marketing suite course. So I will get that link to everybody who who registered for this webinar. I'll make sure that we put that link into the, um, follow-up email from the webinar. Alright? Thanks. And, actually, we are doing a webinar with Eric again in December, so keep your eyes peeled. I know we have a lot of these content opportunities, but these really are geared towards helping you, especially with tactical things you can accomplish in the business even on the webinar. So we really try to make them actionable and, uh, yes, the oh, thank you. Josh put the marketing suite course in the webinar or in the chat for that webinar. Brent, when is part two for this webinar series? It is next week, Thursday. So same time, just a week from today, and that's gonna be led by Josh, and we'll be talking about, you know, how to set the goals and really dive into setting yourself up for success with this from day one. Alright. Cool. Hold on. We've got a couple more questions popping in, so I just wanna make sure. Will this be available to rewatch? Yes. You'll get the recording from this in a follow-up email. It's usually about an hour after the webinar finishes. There's an auto email with the recording link. But with any of our webinars, you can all of them are recorded, and you can always find them on the website under our resources tab. There's a webinar section, and you all you have to do is register for it, and then we'll give you the recording. Okay. Great. Well, thank you all so much. Thanks, Natalie, for joining us and walking us through everything, and we can't wait to hear your feedback, guys. We appreciate all of you, and we'll see you next week.
Natalie Efstahiou:
Thanks.


%20-%202025-08-06T171547.606.webp)
%20-%202025-06-18T170438.281.webp)


.png)


.webp)


.webp)

.webp)


%20-%202025-08-07T222242.577.webp)
%20-%202025-08-05T211155.122.webp)
%20-%202025-08-05T164322.525.webp)
%20-%202025-07-30T123218.666.webp)
%20-%202025-02-07T095206.530.webp)
%20-%202025-06-24T163406.559.webp)

%20-%202025-06-23T164548.621.webp)
%20-%202025-06-20T081954.590.webp)
%20-%202025-06-18T171359.185.webp)
%20-%202025-06-05T133636.454.webp)


%20-%202025-04-29T110753.430.webp)
%20-%202025-04-21T175210.819.webp)
%20-%202025-04-21T143210.386.webp)
%20-%202025-03-31T131609.985.webp)
%20-%202024-07-11T133032.638.webp)
%20-%202025-03-13T132000.152.webp)
%20-%202025-02-24T212907.017.webp)
%20-%202025-02-06T160642.934.webp)
%20-%202025-01-31T134528.551.webp)

%20-%202025-01-21T082443.942.webp)
%20(56).webp)

%20(80).webp)
%20-%202025-01-09T165342.741.webp)

%20(87).webp)
%20-%202024-11-12T131337.086.webp)
%20-%202024-12-30T132528.539.webp)


%20(84).webp)
%20(71).webp)
%20-%202024-11-25T170114.849.webp)


%20(70).webp)


%20-%202024-08-19T140552.131.webp)
%20-%202024-10-10T130747.192.webp)
%20(64).webp)
%20-%202024-08-02T115234.467.webp)
.webp)

%20-%202024-06-21T140425.892.webp)

%20-%202024-05-31T101839.392.webp)
%20-%202024-05-23T180341.929.webp)
%20-%202024-05-13T140513.595.webp)